Airtable Builds
A running record of what I've built in Airtable — across work,
independent projects, and personal use. The platform is the constant;
the problems change.
Influencer Marketing Dashboard, Leaderboard & Compass
Built entirely on Airtable Canvas — a beta product from Airtable Labs being demoed at the event — in a single competitive session. The foundation was AI-powered contract scrubbing: Airtable's AI module automatically extracted payout structures, bonus terms, and performance thresholds from influencer contracts, combining that with existing performance data to fuel three build phases.
The Roster Dashboard surfaced who the team was working with and how each influencer was performing at a glance. The Leaderboard evolved that view to highlight cost-efficiency — not just reach, but value delivered per dollar. The Compass was the research automation layer: Airtable's AI research module automatically found comparable influencers matched by follower count, niche, and platform, then aggregated them to show where the team's current mix was strong or weak by platform and geography. Clicking into any segment revealed how the current roster ranked within the broader competitive set — concrete signal for where to invest next.
OTMM DAM Automation Tracking
Every transaction between the OpenText DAM and the pipelines feeding it — source acquisition and promo production alike — logged, matched, and dashboarded. Those pipelines ran assets through Aspera, SQS, Vantage, and OTMM, and failures were previously invisible until someone noticed a file hadn't arrived. This Airtable system gave every transaction a record: JavaScript matching logic paired send and response events, SLA compliance dashboards surfaced late or failed ingests, and automated escalations fired when high-priority assets missed their windows. Turned anecdotal complaints into a data-backed case for vendor accountability. A roadmap for AI-assisted metadata mismatch detection was scoped but not executed before the layoff.
Azure Cost Tracking
A flat $120K+/month Azure bill with no attribution by show, team, or workload. Built an Airtable system that pulled charge data and categorized it hierarchically — VM to user to group to department — making cloud spend legible for the first time. Identified runaway egress charges and workstations that weren't shutting down between sessions. Enabled chargeback modeling and gave leadership a dashboard they could actually act on. Reduced monthly cloud spend to roughly $100K.
ProdTech Research Platform
A cross-company vendor and technology research platform built for a Production Technology group spanning legacy CBS, Viacom, BET, MTV, Comedy Central, Nickelodeon, Paramount Pictures, and Showtime — teams that had operated independently and had no shared process for how they researched tools, documented findings, or built a case for funding. Airtable was proposed over Wrike specifically because the problem needed a relational data model, not a task queue. Three linked layers — Concepts, Use Cases, and Technologies — let anyone start from any angle: a problem to solve, a vendor to evaluate, or a concept to explore. Also cataloged the actual technology footprint across teams, so a group in LA could see what a team in Nashville was already running before starting from scratch.
Source Acquisition Tracking & Delivery Status
As source assets arrived through the acquisition pipeline, Aspera Orchestrator created a corresponding record in Airtable for each one — episode, clip, or special. Internal Airtable automations handled housekeeping, and Zapier watched for new source proxy files, matching them back to their records and injecting the Frame.io viewing link once available. Linkage to official show, season, and episode records meant acquisition status could be surfaced in interfaces built for operations, creative, production, and campaign management teams — giving everyone visibility into where their assets were without having to ask.
Technical Asset Tracking
A relational inventory of the full technology fleet — cloud VMs, on-premise bare metal, hardware in stock, and hardware deployed to users. Tracked what had been sent out, to whom, and what state it was in. The Azure Avid VM environment saw regular turnover — new users, configuration changes, performance issues — and the tech team consulted this system constantly when responding to tickets and help requests. Tied into the cost tracking work to give a complete picture of what was running and what it was costing.
Serve LA Donation Tracker
Serve LA collects roughly 2,000 lbs of food per day from grocery stores across Hollywood, using it to prepare over 1,000 meals a week served five days a week to those in need — with surplus distributed further through partner ministries. The operation ran on informal tracking and memory. Built an Airtable system to bring structure to donation intake, collection logistics, and distribution — giving the team a clear picture of what was coming in, where it was going, and what the operation was actually accomplishing.
Marvel Trading Card Collection Tracker
A full collection management system for a growing Marvel trading card collection — focused on set completion and artwork appreciation rather than investment value. Four components: an Encyclopedia with gallery, binder, and statistical views; a Collecting Dashboard showing set completion status and surfacing only the missing cards when browsing for fills; a real-time Logging Interface that increments owned counts with a single click when working through a physical stack; and a Character Catalog aggregating cards by character across all sets. Built using Airtable Canvas and Claude for data processing, image handling, and interface iteration.
Concert Tracker
Every show logged — venue, openers, who came along — with a most-seen-artist leaderboard. After three decades of attending shows, it can be hard to keep the record straight. Now I can.
Job Application Tracker
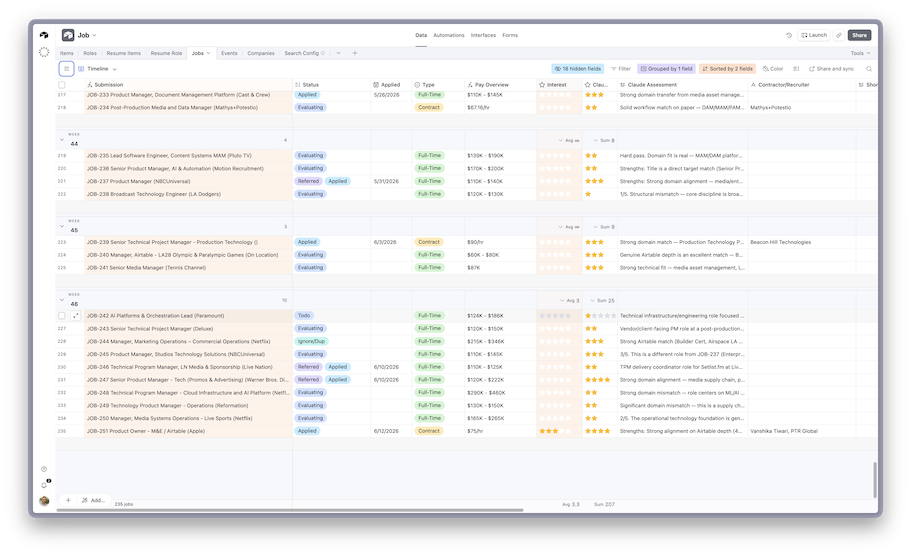
A pipeline tracker for the job search — application status, follow-up timing, contact log, and a view that turns scattered activity across multiple job boards into something readable. The same funnel thinking I'd apply to any operational process, pointed at finding the next role.